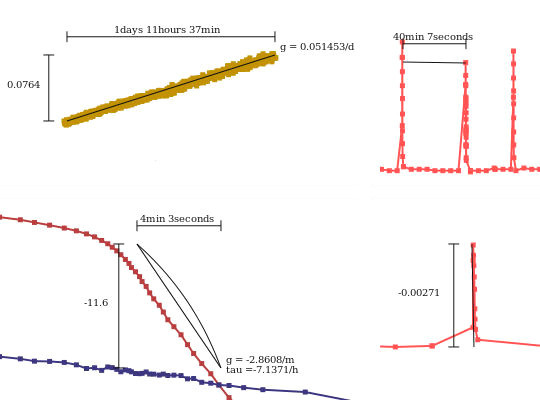
Measuring
After picking the measure mode, interactively click and drag out a line to measure what's on the graph. Mobile users can use two fingers to draw a line.
Depending on the axis modes, the measure tool will show:
- Deltas
- Gradients
- Time constants
- Powerlaws
It works with times axes too: get results in /ms /s /m /h or /day.
Multi Touch
Touch screen users aren't left out. They can intuitively use two finger to move around the graph. Panning and zooming around setting the scale on both axes at once. While doing this an image of the graph is distorted so placement is easy. This is achieves buttery smooth animations.
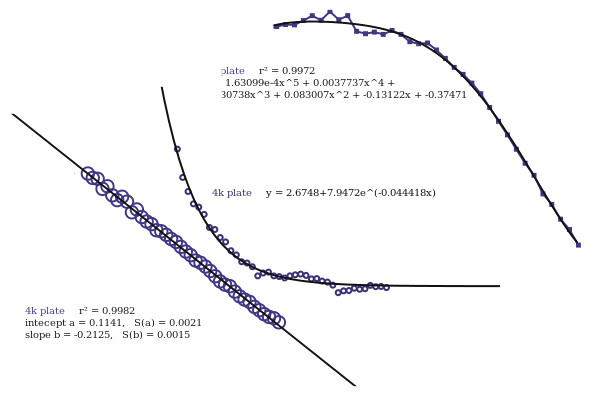
Data Fits
Get quick results or make predictions.
- Linear fits with error estimation
- Polynomials.
- Exponential Decays, with and without an offset +c
Data fittings also work on time series data using pre-fit normalisation.
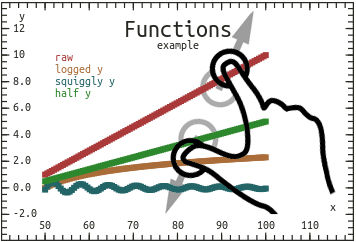
Data Transformations
Quick bits of analysis are easy with a system of stacking data transformations. Each transformation runs on top of the last like c(b(a(data))).
- Many common operations
- 1/x, log(), ln(), exp() etc
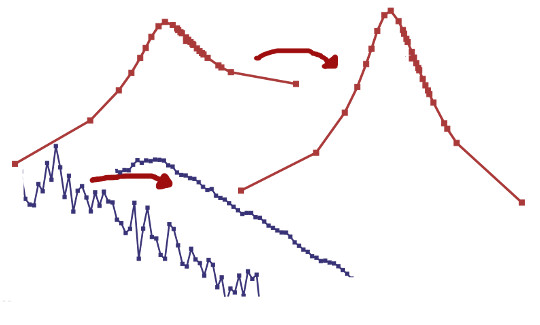
- Smooth (with variable aperture)
- dy/dx, integrate
- y vs y
- Jitter, subtract line
- custom functions.
- subtract fit, remove outliers.
- and more!
Clicking again on a function can change it's arguments, e.g. smoothing aperture. There are also pop and reset options to remove the last applied transform or to remove all of them.
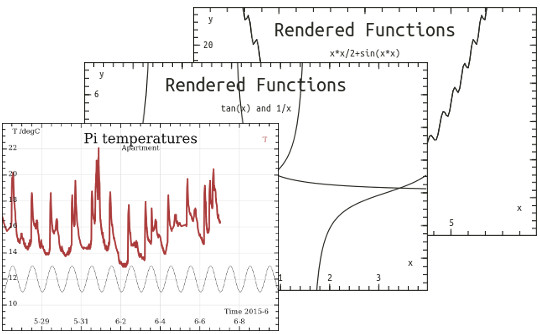
Function Plotter
Include quick lines without resorting to coding.
- Drawn on-the-fly
- Infinite canvas
- Functions even on a time axis
When on a time axis the evaluator uses x as milliseconds from epoch. Cyclic functions work well (and is the default) but there is also the variable now available to get the current time in ms.
Data Export
Get actual useful data straight from the graph. No data-readers required here!
You can get the data out and into a format you want to use.
In testing: there is a link export mode that generates a long url from the graph including all the data, captions, styles, transformations, and fits. Send this link to a peer and they will be able to see the graph just as you see it.
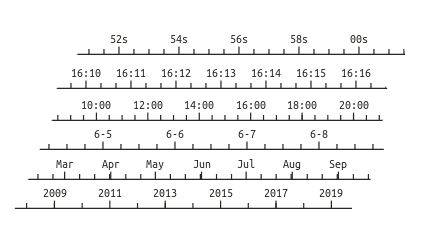
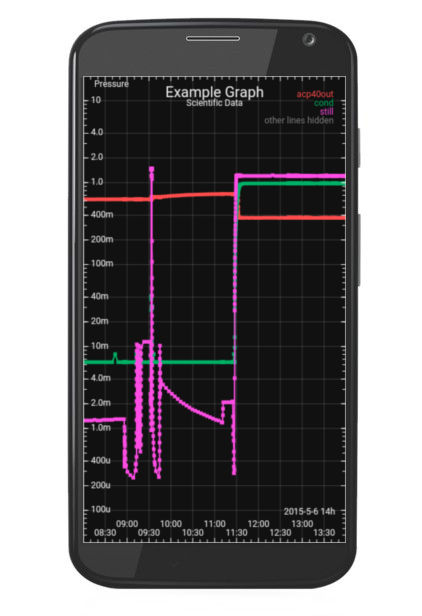
Time Axis
Fully automatic, fully working time axis.
- Any scale between 0.001ms to 10years.
- Unambiguous, shows enough information without clutter.
Only picks useful scales with sensible ticks and resolution. Handling months with different number of days. Leap days, and leap seconds OK.
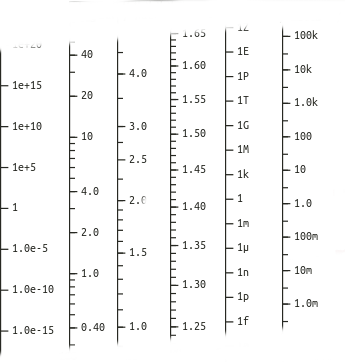
Log Scales that Work
Never get stuck with a view that can't tell where it is. It works continuously even if the data covers 100s of orders of magnitude or 1/100th.
- Normal log
- Zoomed in log scales that look just like a skewed linear scale.
- Far zoomed out view, handle well spaced orders of magnitude
- When using SI units, jump in powers of three only.
Fullscreen Graphs
Press the fullscreen button to launch any graph fullscreen. Get the most out of valuable mobile screen space.
Great for small screens, tablets, phones, and overhead monitors.
Not working on Apples's Safari until they implement the fullscreen API
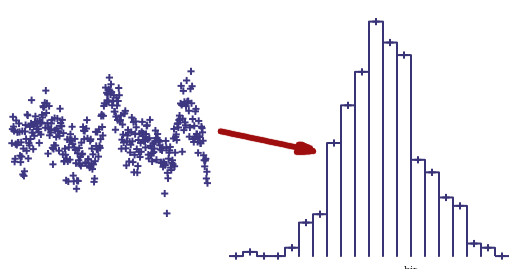
Histogram Generator
Using hist, one of the many stackable functions. It returns the bin centers and counts, then use the histogram line mode to view a histogram.
- Auto binning, nice scales.
- Even on a log axis.
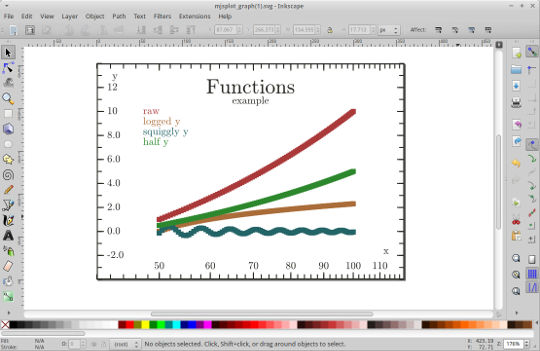
Take graphs further
Make all the adjustments you want in whatever editor you want. Image export options:
- vector format graphs as .svg
- 300dpi raster graphs as .png
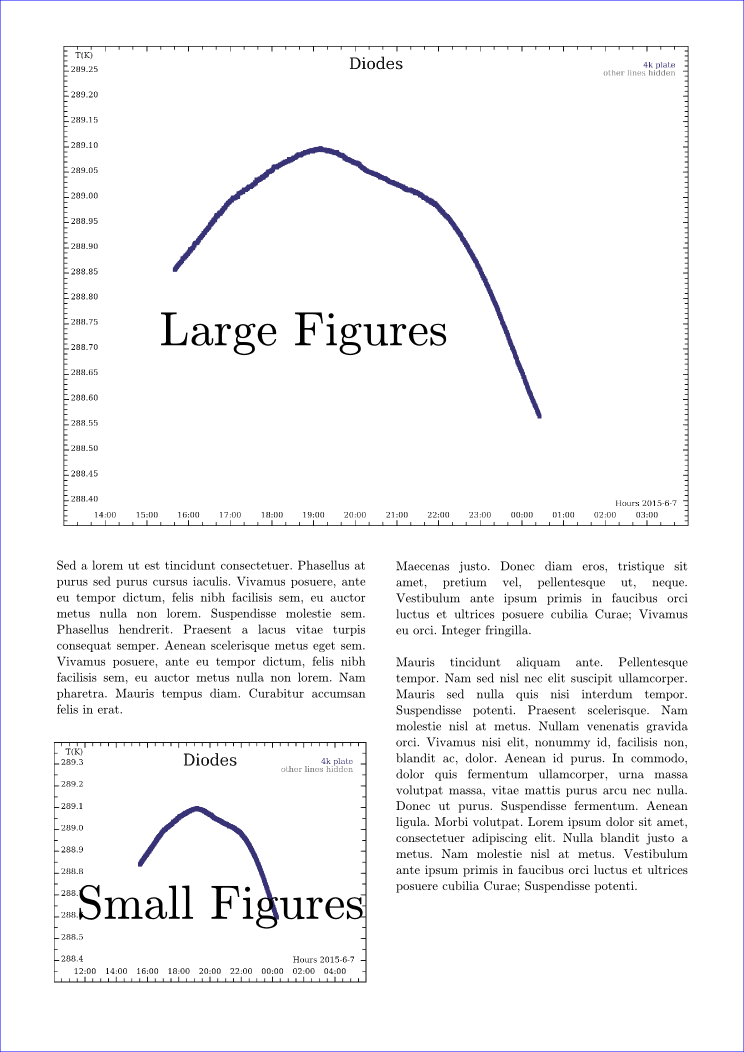
Pre-set sizes
You can get any size graph you want, just by resizing the canvas. There are pre-defined sizes for small and large figures commonly used in papers or reports.
Playground
Build Your Own
The Playground.
This is a space where you can import data, manipulate it, and then plot using MJS plot. The interface on this page is simplified and made to imitate like matplotlib and matlab.
Demos
Three Fullscreen
Pulls data from different sources, Three graphs on a screen. Shows setting defaults. A frozen snapshot from a live page.
This page isn't so mobile friendly. It was written for an overhead display.
Time series Data
Mobile Friendly. A snapshot of some measured temperatures.
Exponential Data
Also Mobile Friendly. You can try out different fits from this data set.
Contact
Contact
MJS plot subreddit A place to complain about everything, or show off, or ask for help. The developer hangs around here.
Google+ Posts about MJS plot are sometimes made here.
Implementation
The hardest part of using MJS plot for logging is getting your data accessible online. This is typically just read asynchronously, or included in the webpage.
The a quick api reference is available as well as a more tutorial style guide
Plating Data
The minimal code to get a graph.
var demo1Graph = mjs_plot.new_graph("demo1Graph","demo1");

var x = [1,2,3,4];

var y = [8,6,2,6];

demo1Graph.set_data([[x,y]]);

demo1Graph.set_captions(["Basic Line"]);

demo1Graph.mjs_plot();
The canvas has id="demo1".
Customisation
Accessible via the graphics_style and default_graphics_style
If you want to force the change, or just setup the first view
var demo2Graph = mjs_plot.new_graph("demo2Graph","demo2");

demo2Graph.set_data([[x,y]]);

demo2Graph.set_captions(["Basic Line"]);

demo2Graph.default_graphics_style.title = "Example Graph";

demo2Graph.default_graphics_style.show_grid = true;

demo2Graph.default_graphics_style.y_scale_mode = "log";

demo2Graph.default_graphics_style.x_axis_title =  "x";
demo2Graph.default_graphics_style.y_axis_title =  "y";
demo2Graph.mjs_plot();
You can setup everything, colours, fonts, subtitles, axis labels and more.
Multiple Lines
As many lines as you want. Each line gets a colour that is separated in HLS space.
...

demo3Graph.set_data([[x,y],[x2,y2]]);

demo3Graph.set_captions(["First Line","Second Line"]);
demo2Graph.mjs_plot();
Working with Time
Time strings get processed into milliseconds from epoch. Many time strings work, but the preferred type is ISO 8601.
var demo4Graph = mjs_plot.new_graph("demo4Graph","demo4");

var t = ['April 20 2015', 'May 3 2015', '2015-05-25T12:00:00Z'];

var h = [1.2e-15,6e6,8e16];

var t = mjs_plot.convert_time_strings(t);

demo4Graph.set_data([[t,h]]);

demo4Graph.set_captions(["Time Series"]);

demo4Graph.default_graphics_style.x_scale_mode =  "time";

demo4Graph.default_graphics_style.y_scale_mode =  "log";

...
Test the time string you want to use with the time tester
Here you can also see the y-axis data spanning many orders of magnitude begin plotted just fine.
MJS 2014-2015